What's Wrong and What's Right
with Risk Matrices for Safety Risk Assessment?
Introduction
The two titles from popular papers, Cox [1] and Talbot [2] are intentionally combined and paraphrased to bring attention to the risk matrix issues and limitations that are well-covered in many professional and scientific articles, but at the same time, often neglected by safety practitioners and sometimes even by authorities.
So, what’s wrong with the risk matrix used for safety issue risk assessment?
Actually, nothing is wrong if
a) we are familiar with the risk matrix fundamentals
b) we are aware of the limitations of risk matrices
c) our arbitrarily designed risk matrices do not fail to provide consistency according to Cox [1]
d) our risk statement is well-designed
e) our likelihood and consequence categories are robust and unambiguously specified
f) we are able to collect representative data for historical occurrences
Hoping that clarification of these requirements might be helpful for safety practitioners in their every-day tasks, all the above topics are covered in more detail below.
Risk matrix fundamentals
Risk is commonly expressed in terms of a combination of the consequences (or severity) of a possible future event and the related likelihood (or probability) of event occurrence.Safety Issue Risk is entirely focused on future events of the same type (events resulting from the same hazard) and should not be mixed with Event Safety Risk.
(More about this here: Comparison of Methods for Event Safety Risk Assessment in Aviation )
Due to the acceptable assumption that Exposure is mainly constant for a single aviation safety issue, the common risk formula
Risk = f (Severity, Probability, Exposure) is simplified to Risk = Severity x Probability
According to this formula, all Safety Risk Matrices are designed as a two-dimensional matrix, actually, a simple table that could have any number of categories of Severity and Probability for its columns and rows. The associated level of risk is defined for each row-column pair, so theoretically the maximum number of different levels of risk is the number of table cells. In practice, the most common design of the Safety Issue Risk Matrix in aviation is a 5x5 table having five ordinal rating categories (qualitative or semi-quantitative) for likelihood and severity.
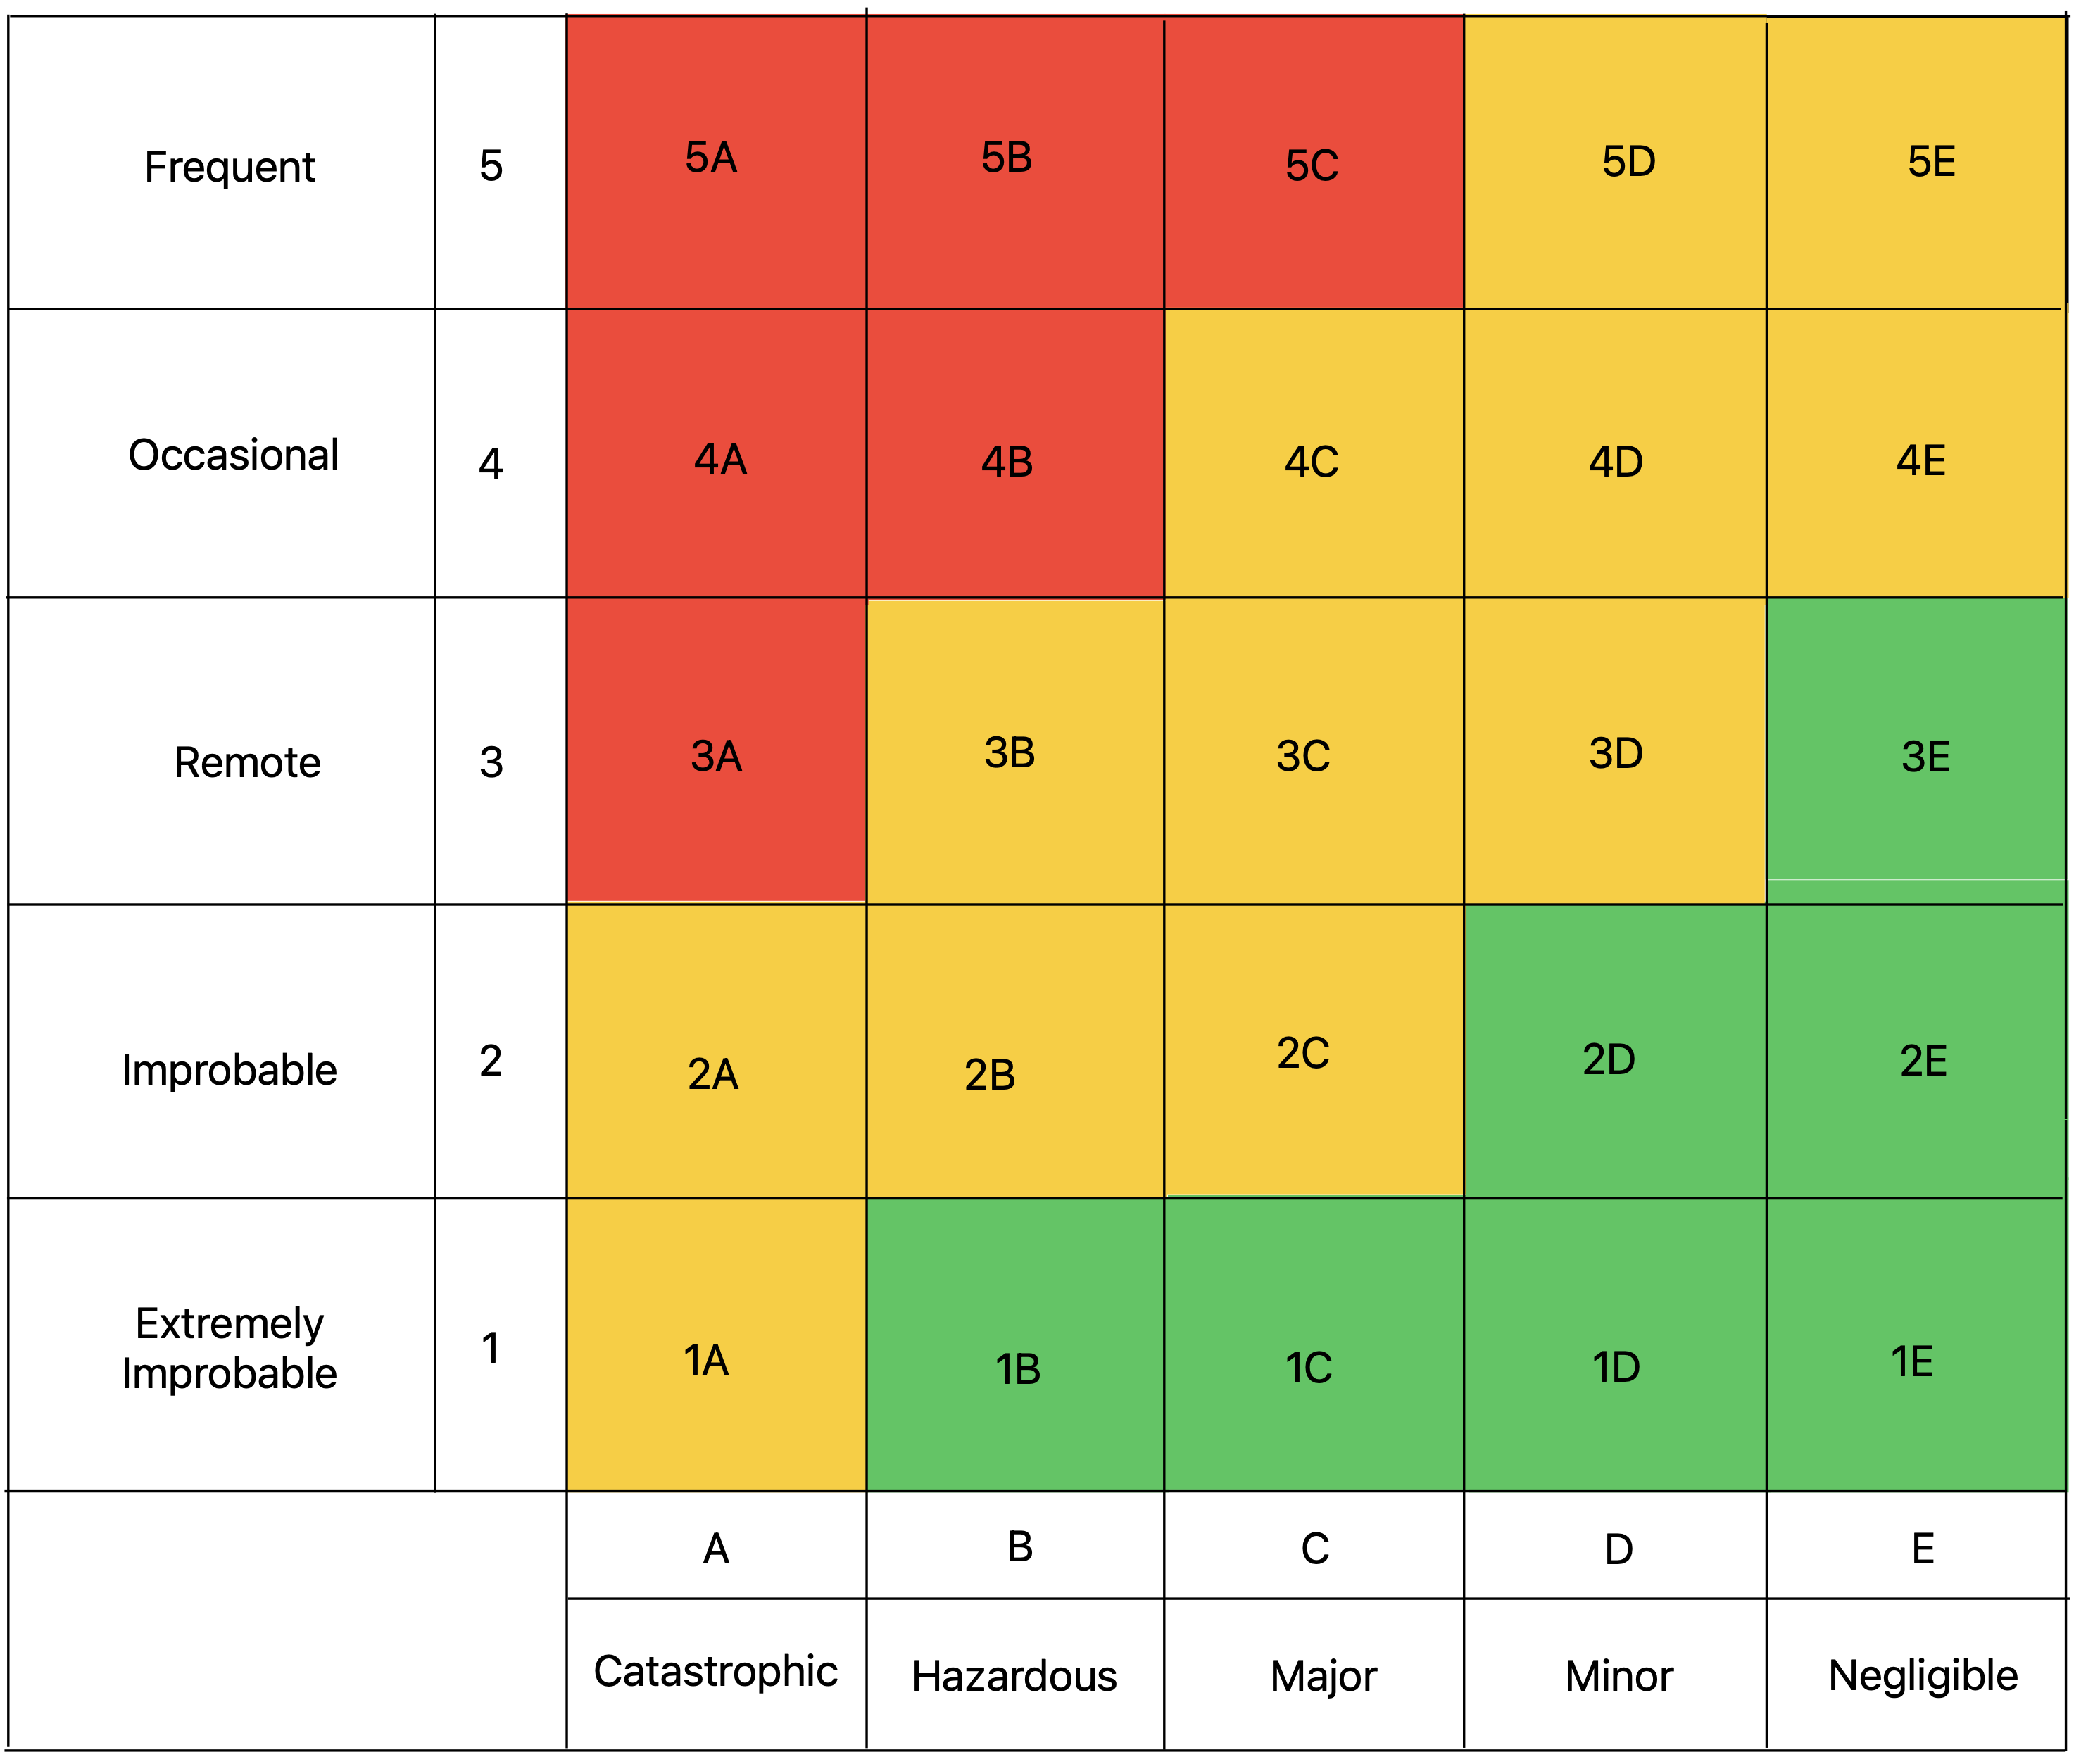
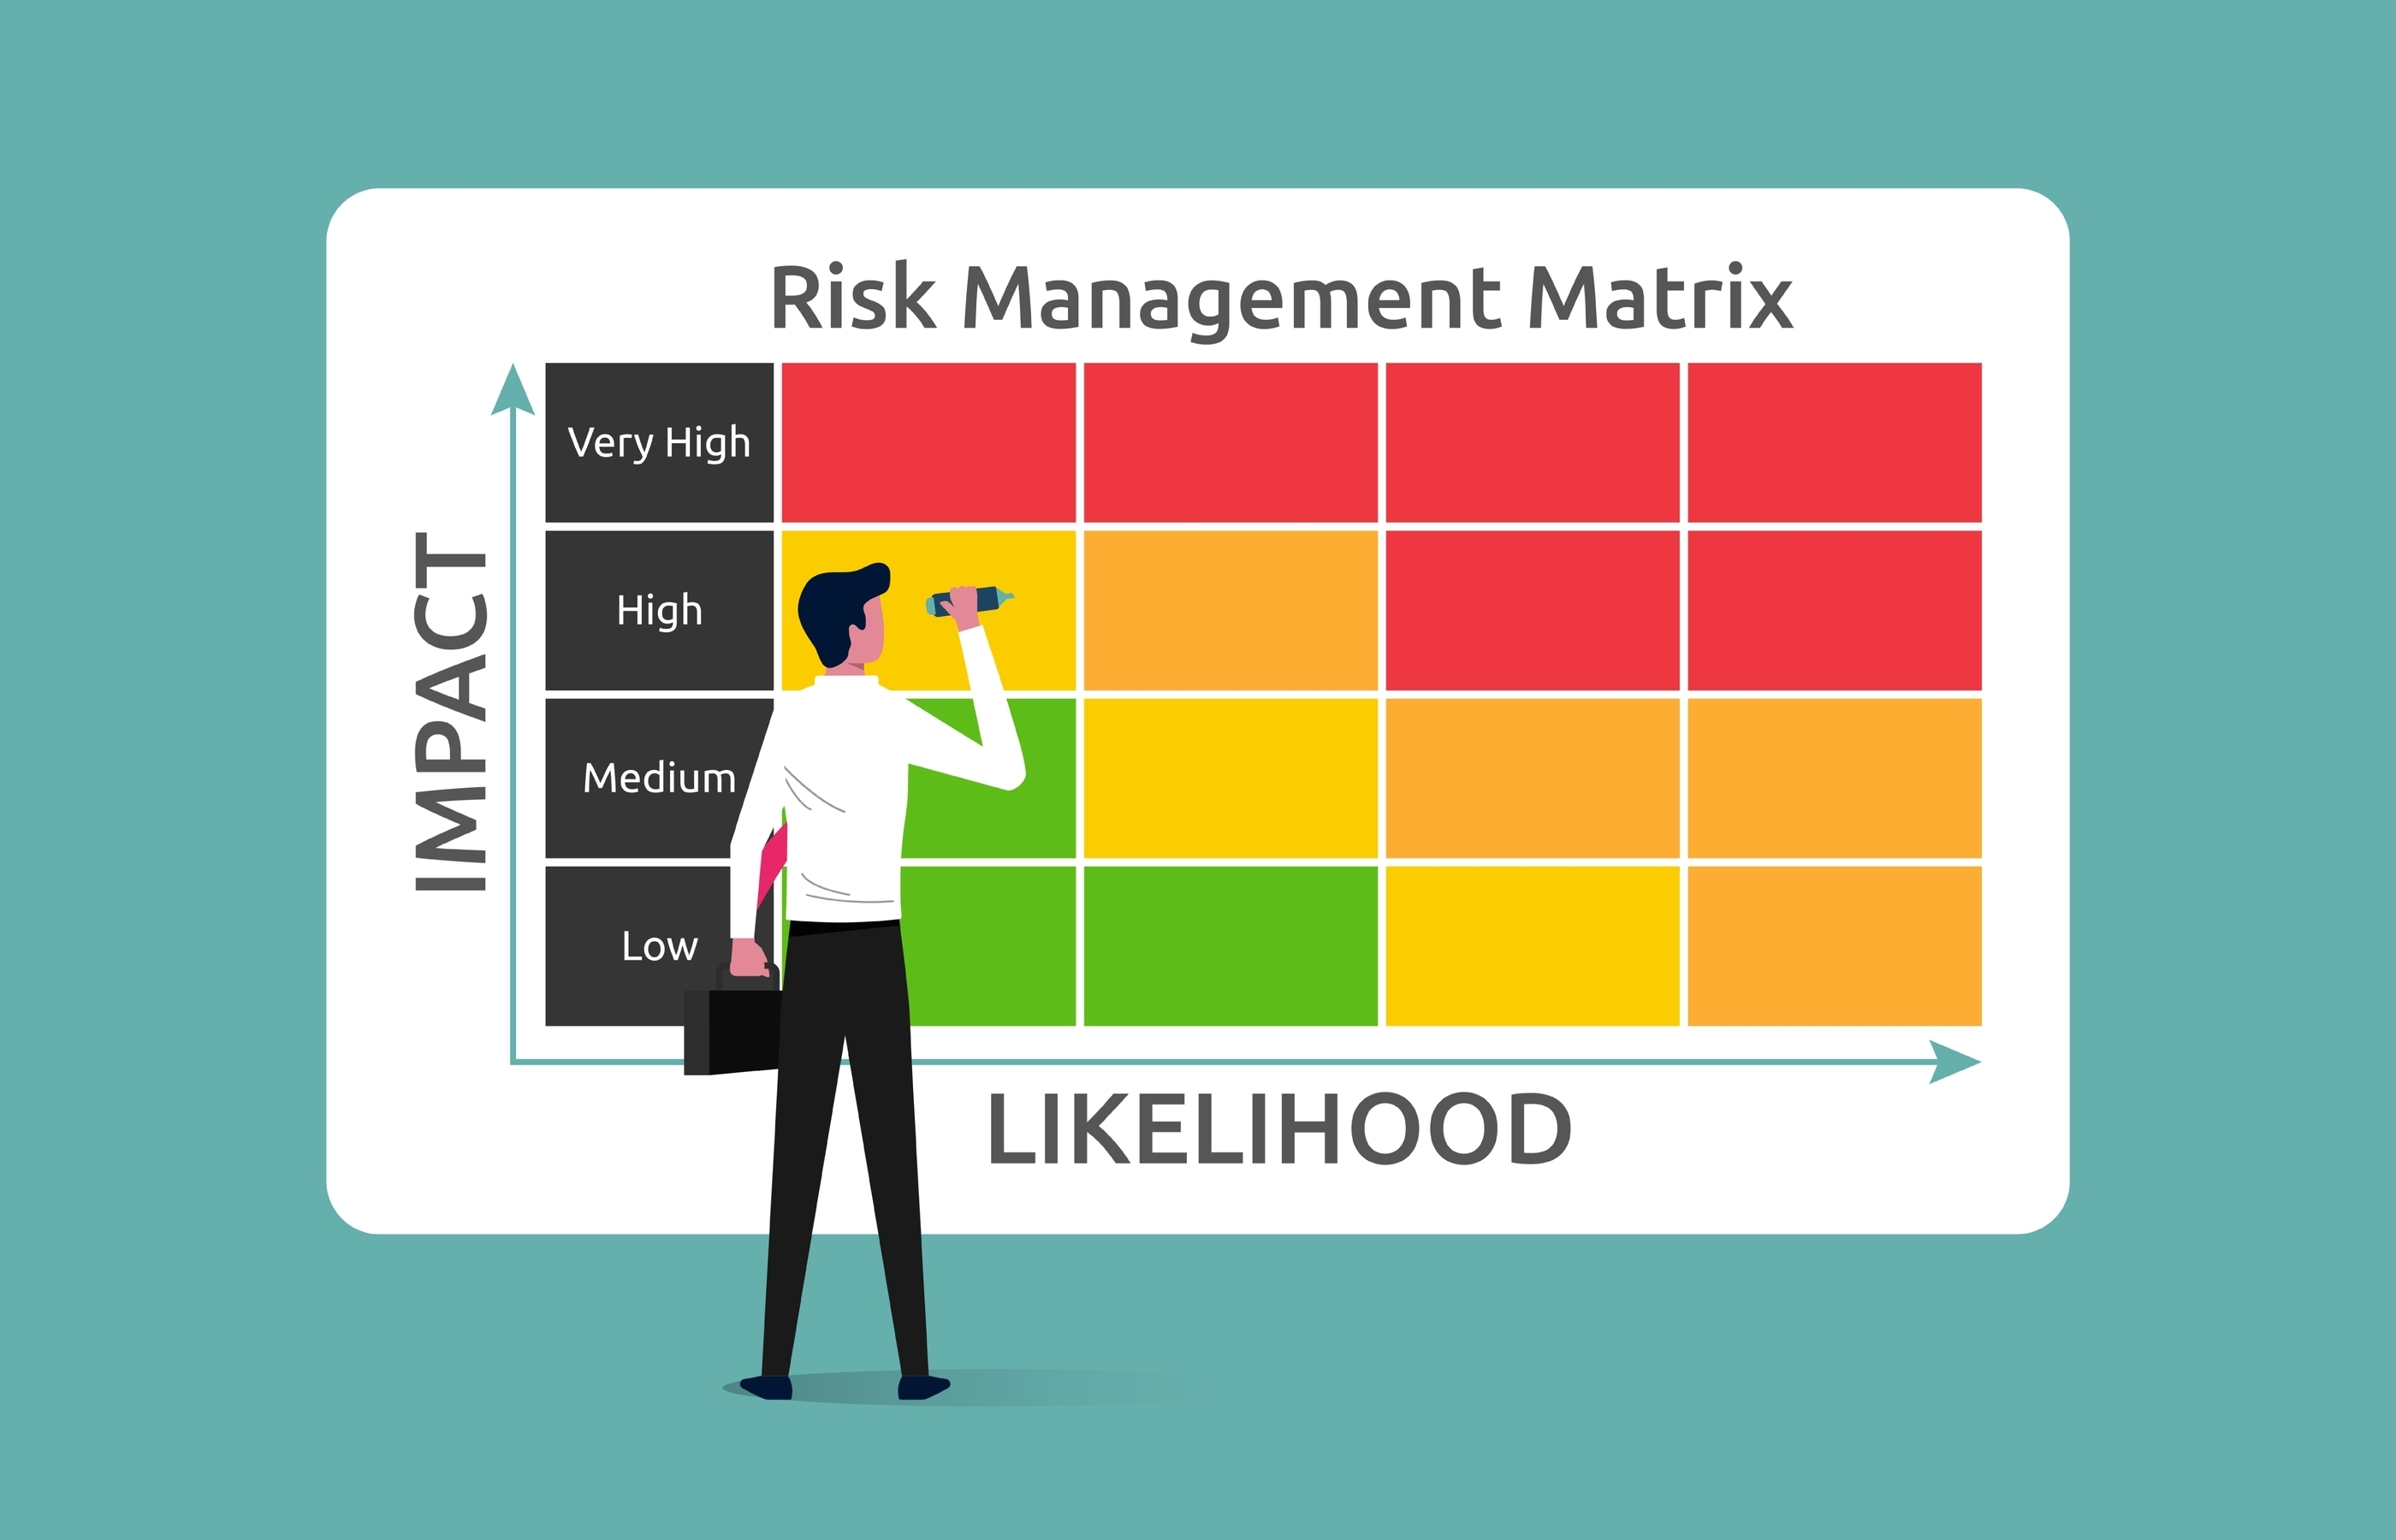
Fig.1 - 5x5 risk matrix with the three levels of risks provided by ICAO [3]
The above risk matrix is quite counterintuitive because the highest risk cells are located in the top left corner instead of in the top right corner, and because of the mixed usage of letters and numbers for semi-quantitative values for severity/likelihood categories.
Fig.2 shows another example of the 5x5 risk matrix based on the NIST SP 800-30 schema for converting qualitative likelihood/severity categories into semi-quantitative values with 5 risk levels. (Note the semi-quantitative values also has ordinal ranking and should not be mixed with quantitative scales for likelihood and severity)
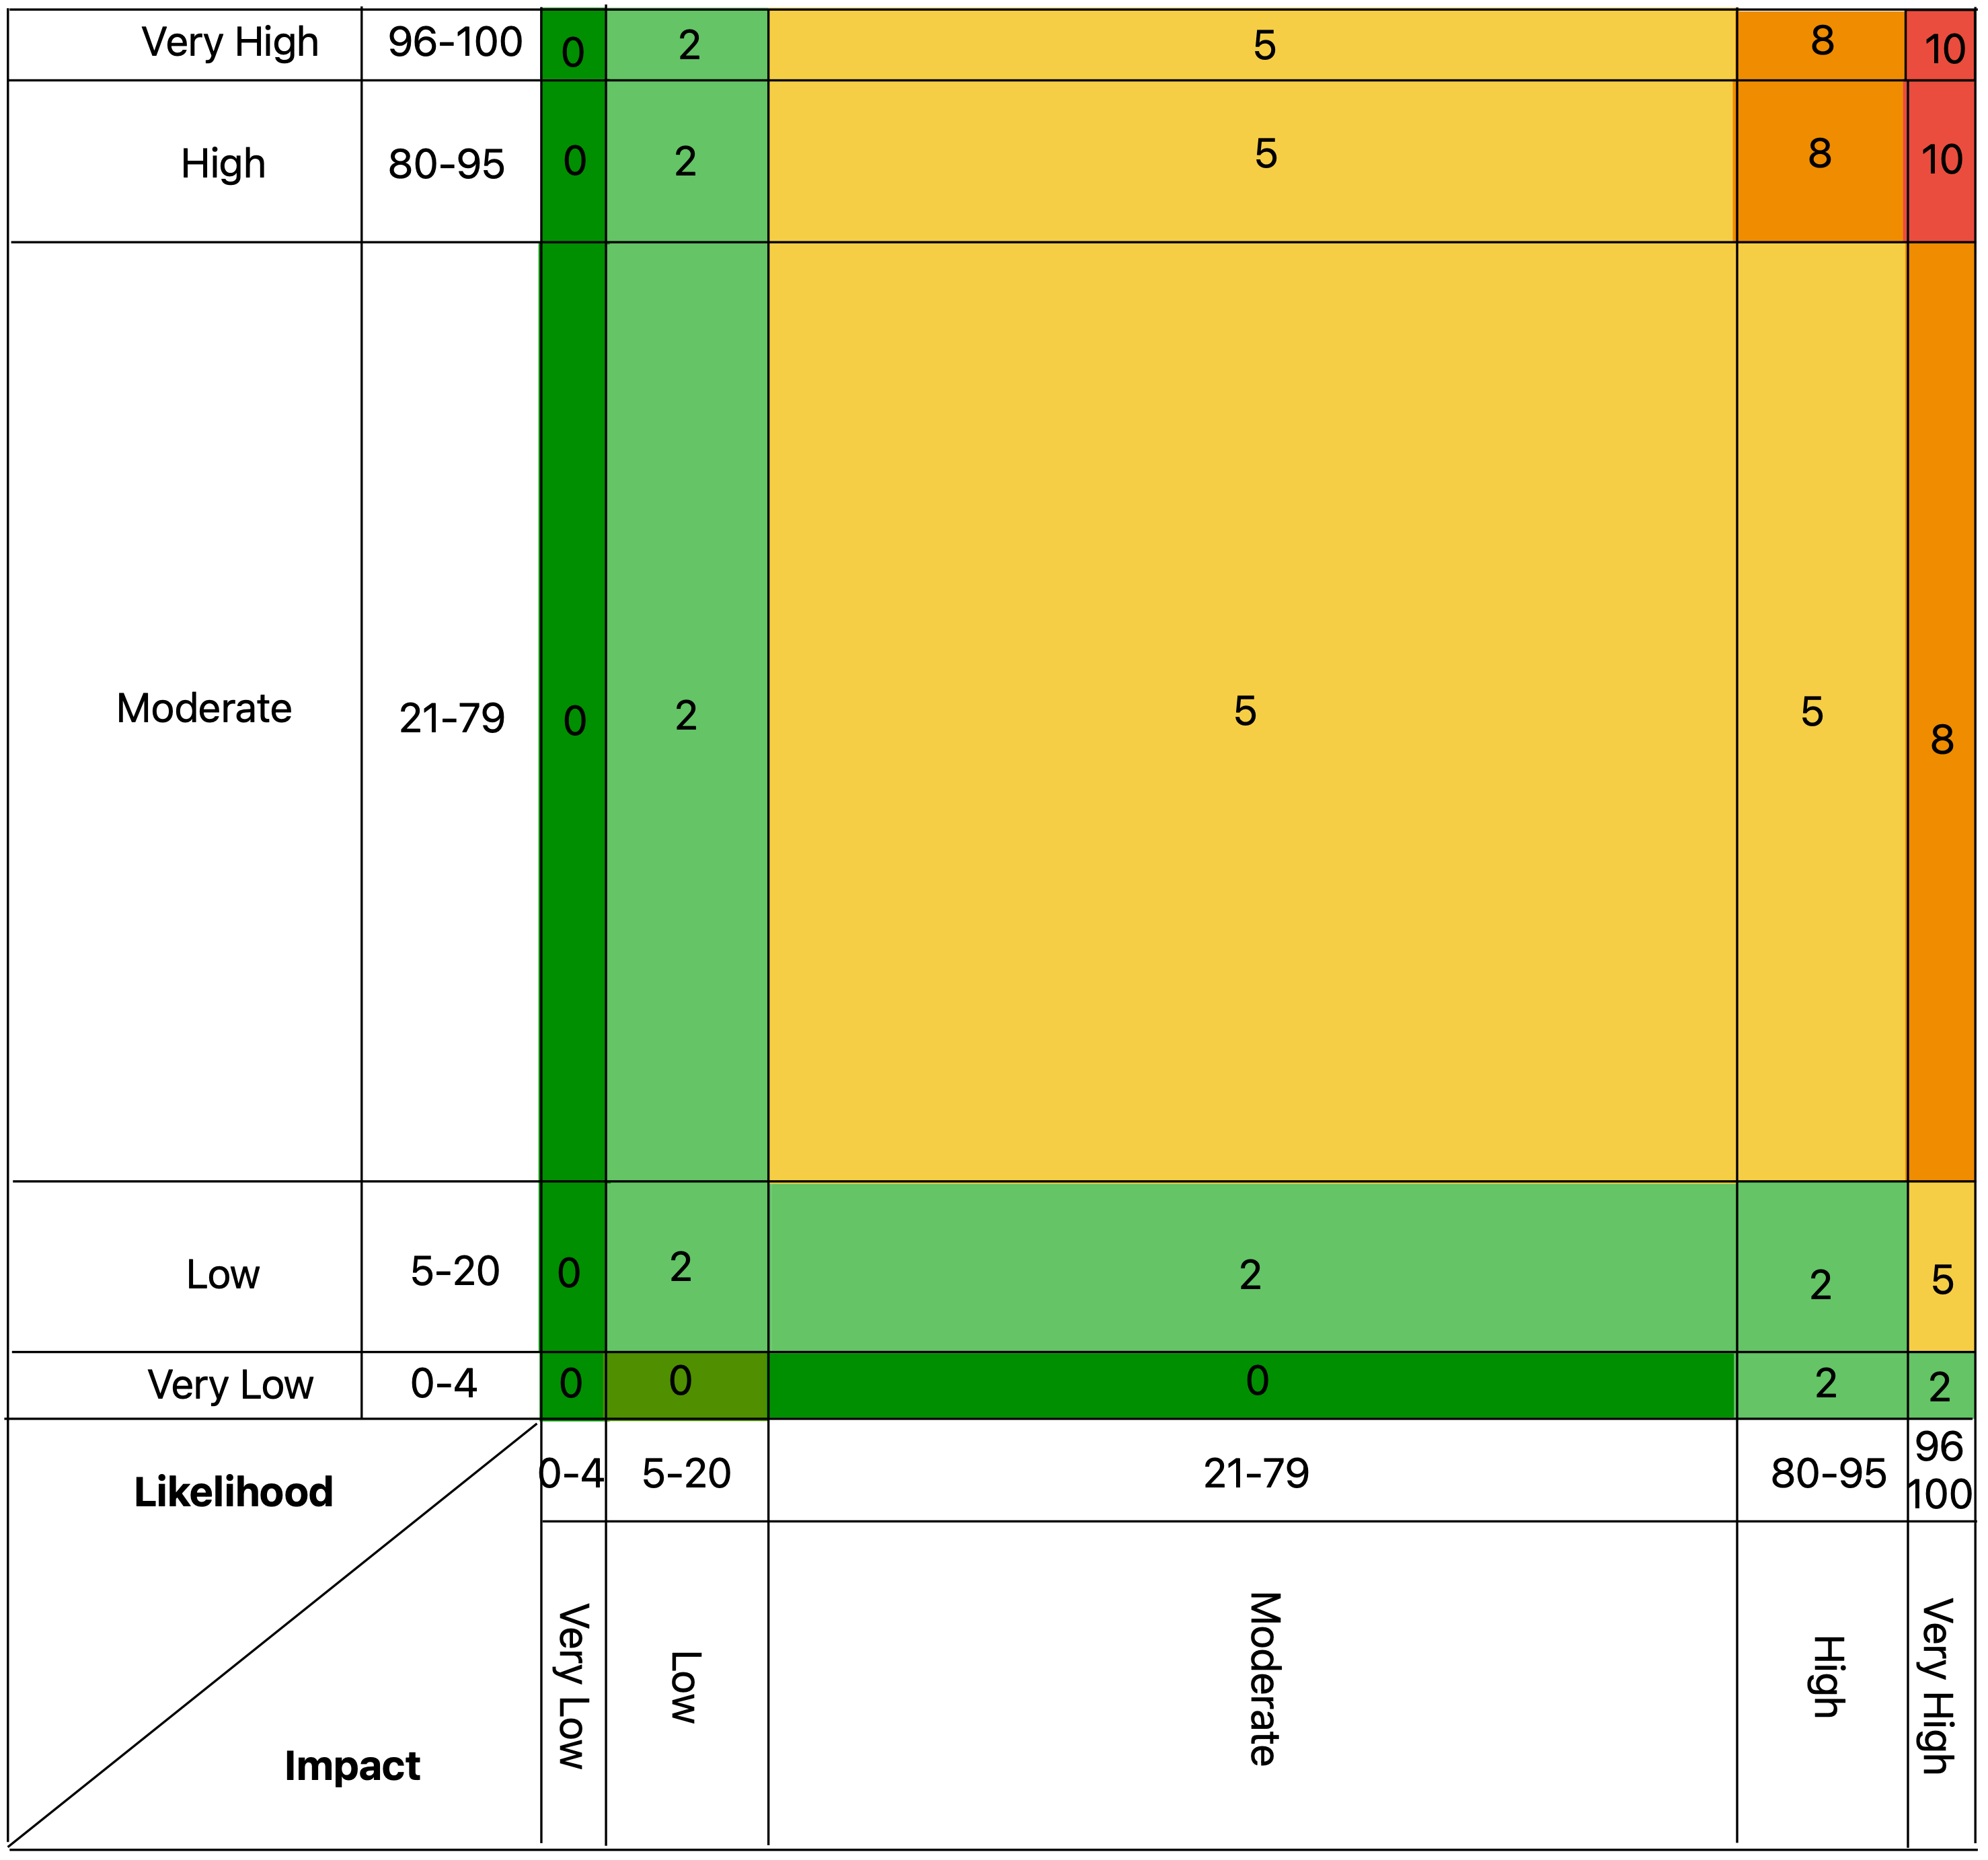
Fig.2 - 5x5 risk matrix with the five levels of risks provided by NIST [4]
Some service providers are using the same management system for safety and security management and the same two-dimensional risk matrix discussed above for safety and security issues risk assessment.
This is fundamentally wrong because the formula for the security risk has two probability factors (Probability of Event Initiation and Probability of Event Resulting in Adverse Impacts), and therefore a three-dimensional (not two-dimensional) matrix has to be used for security risk assessment.
Limitations of the risk matrices
Risk matrices are established and commonly used tools to assess and classify risk that almost everyone accepts without questions.
Here are some widely acknowledged benefits and advantages of this tool:
- can be compiled relatively quickly
- promotes discussion in risk workshops
- enables quick ranking and comparison of risks for attention
- can be used to help develop a common understanding of levels of risk across an organization
- enables the combination of consequences and their likelihood to be represented graphically
- shows graphically whether a risk is outside the risk appetite of an organization
- shows graphically risk criteria
- enables decision makers to focus on the highest priority risks
- proven (or seemingly proven?) in use over many decades
- widely adopted and used in many standards
But despite its widespread usage and acceptance, there are some important flaws and limitations with the risk matrices based on ordinal scales for frequency and severity, that should not be neglected.
Anthony Cox [1] was the first author to identify severe problems that could reduce their effectiveness (even to the point when they are “worse than useless”). After that, many other authors reviewed the accuracy and reliability of the risk levels derived from risk matrices based on qualitative or semi-quantitative scales of the severity and likelihood and most of the results were not encouraging.
Here are some of the main risk matrices limitations:
i) Poor Resolution
This is related to the inability to distinguish the relative importance of risks in the same risk category. Typical risk matrices can correctly and unambiguously compare only a small fraction (e.g. less than 10%) of randomly selected pairs of hazards.
ii) Range compression (or Incorrect Quantitative Ranking of Risk)
By pressing the real values of likelihood/severity into a schema of ordinal scales, the risk matrices can assign identical ratings to quantitatively very different risks. (Risks with lower quantity values are assigned to higher risk categories and vice versa)
iii) Neglecting of correlation between frequencies and severities
This is one of the most overlooked problems of the risk matrices. Cox [2] discussed that uncorrected negative correlations between frequencies and severities could lead to a “worst than random” risk assessment.
iv) Ambiguity
The frequency/severity scales are often not defined precisely and therefore the input selection is subjected to cognitive bias.
v) Centering Bias
Humans are biased and there is a tendency to avoid extreme values. They tend to underestimate the probabilities or overestimate bad outcomes. (This can partly be resolved by adequate training)
Inconsistency in arbitrarily designed risk matrices
Trying to avoid poor resolution and range compression by adding more frequency/severity categories and more risk levels (colors) make this problem even more complicated. Such arbitrarily designed risk matrices generally fail to provide risk matrix consistency.
According to Cox et al. [1] consistency means that the resulting risk score should relate directly to the real quantitative risk. He also defined three axioms that should be satisfied by risk matrix design:
1. Weak Consistency: A risk matrix with more than one color (level of risk priority) for its cells satisfies weak consistency with a quantitative risk interpretation if points in its top risk category represent higher quantitative risk than points in its bottom category.
2. Betweenness: Small changes in probability or severity should not cause jumps in risk categorization from the lowest to the highest category without going through at least one intermediate cell (one that is neither green nor read)
3. Consistent coloring: The risks of the same qualitative category level should have approximately the same quantitative risk values.
If the risk matrix with green, yellow, and red risk categories satisfies weak consistency, betweenness, and consistent coloring then:
a) No red cell can share an edge with the green cell
b) No red cell can occur in the left column or in the bottom row (assuming that axes are oriented to show increasing frequency and severity and that the lower left cell is green and the upper right cell is red)
c) All cells in the second column from the left and second row from the bottom are not red
Following these restrictions, there are no 2x2 matrices that can satisfy weak consistency; there is only one possible coloring schema for 3x3 matrices; and there are only two possible coloring schemas for 4x4 and 5x5 matrices.
Although the above consistency discussion requires that 5x5 matrices must have exactly three colors, many (even approved) risk matrices used have four (or more) level of risks (risk colors).
The real life 5x5 matrix with four risk colors is shown in Fig.3. It is easy to recognize that this risk matrix assigns lower risk rating (brown) for cells B3 and C4 than for cell A2 (red), although the former cells have a risk product of 12 and the latter a risk product of 10. (The same discussion applies also to cells C2 and D3 vs A1 cell, and for D2 vs C1 cells)
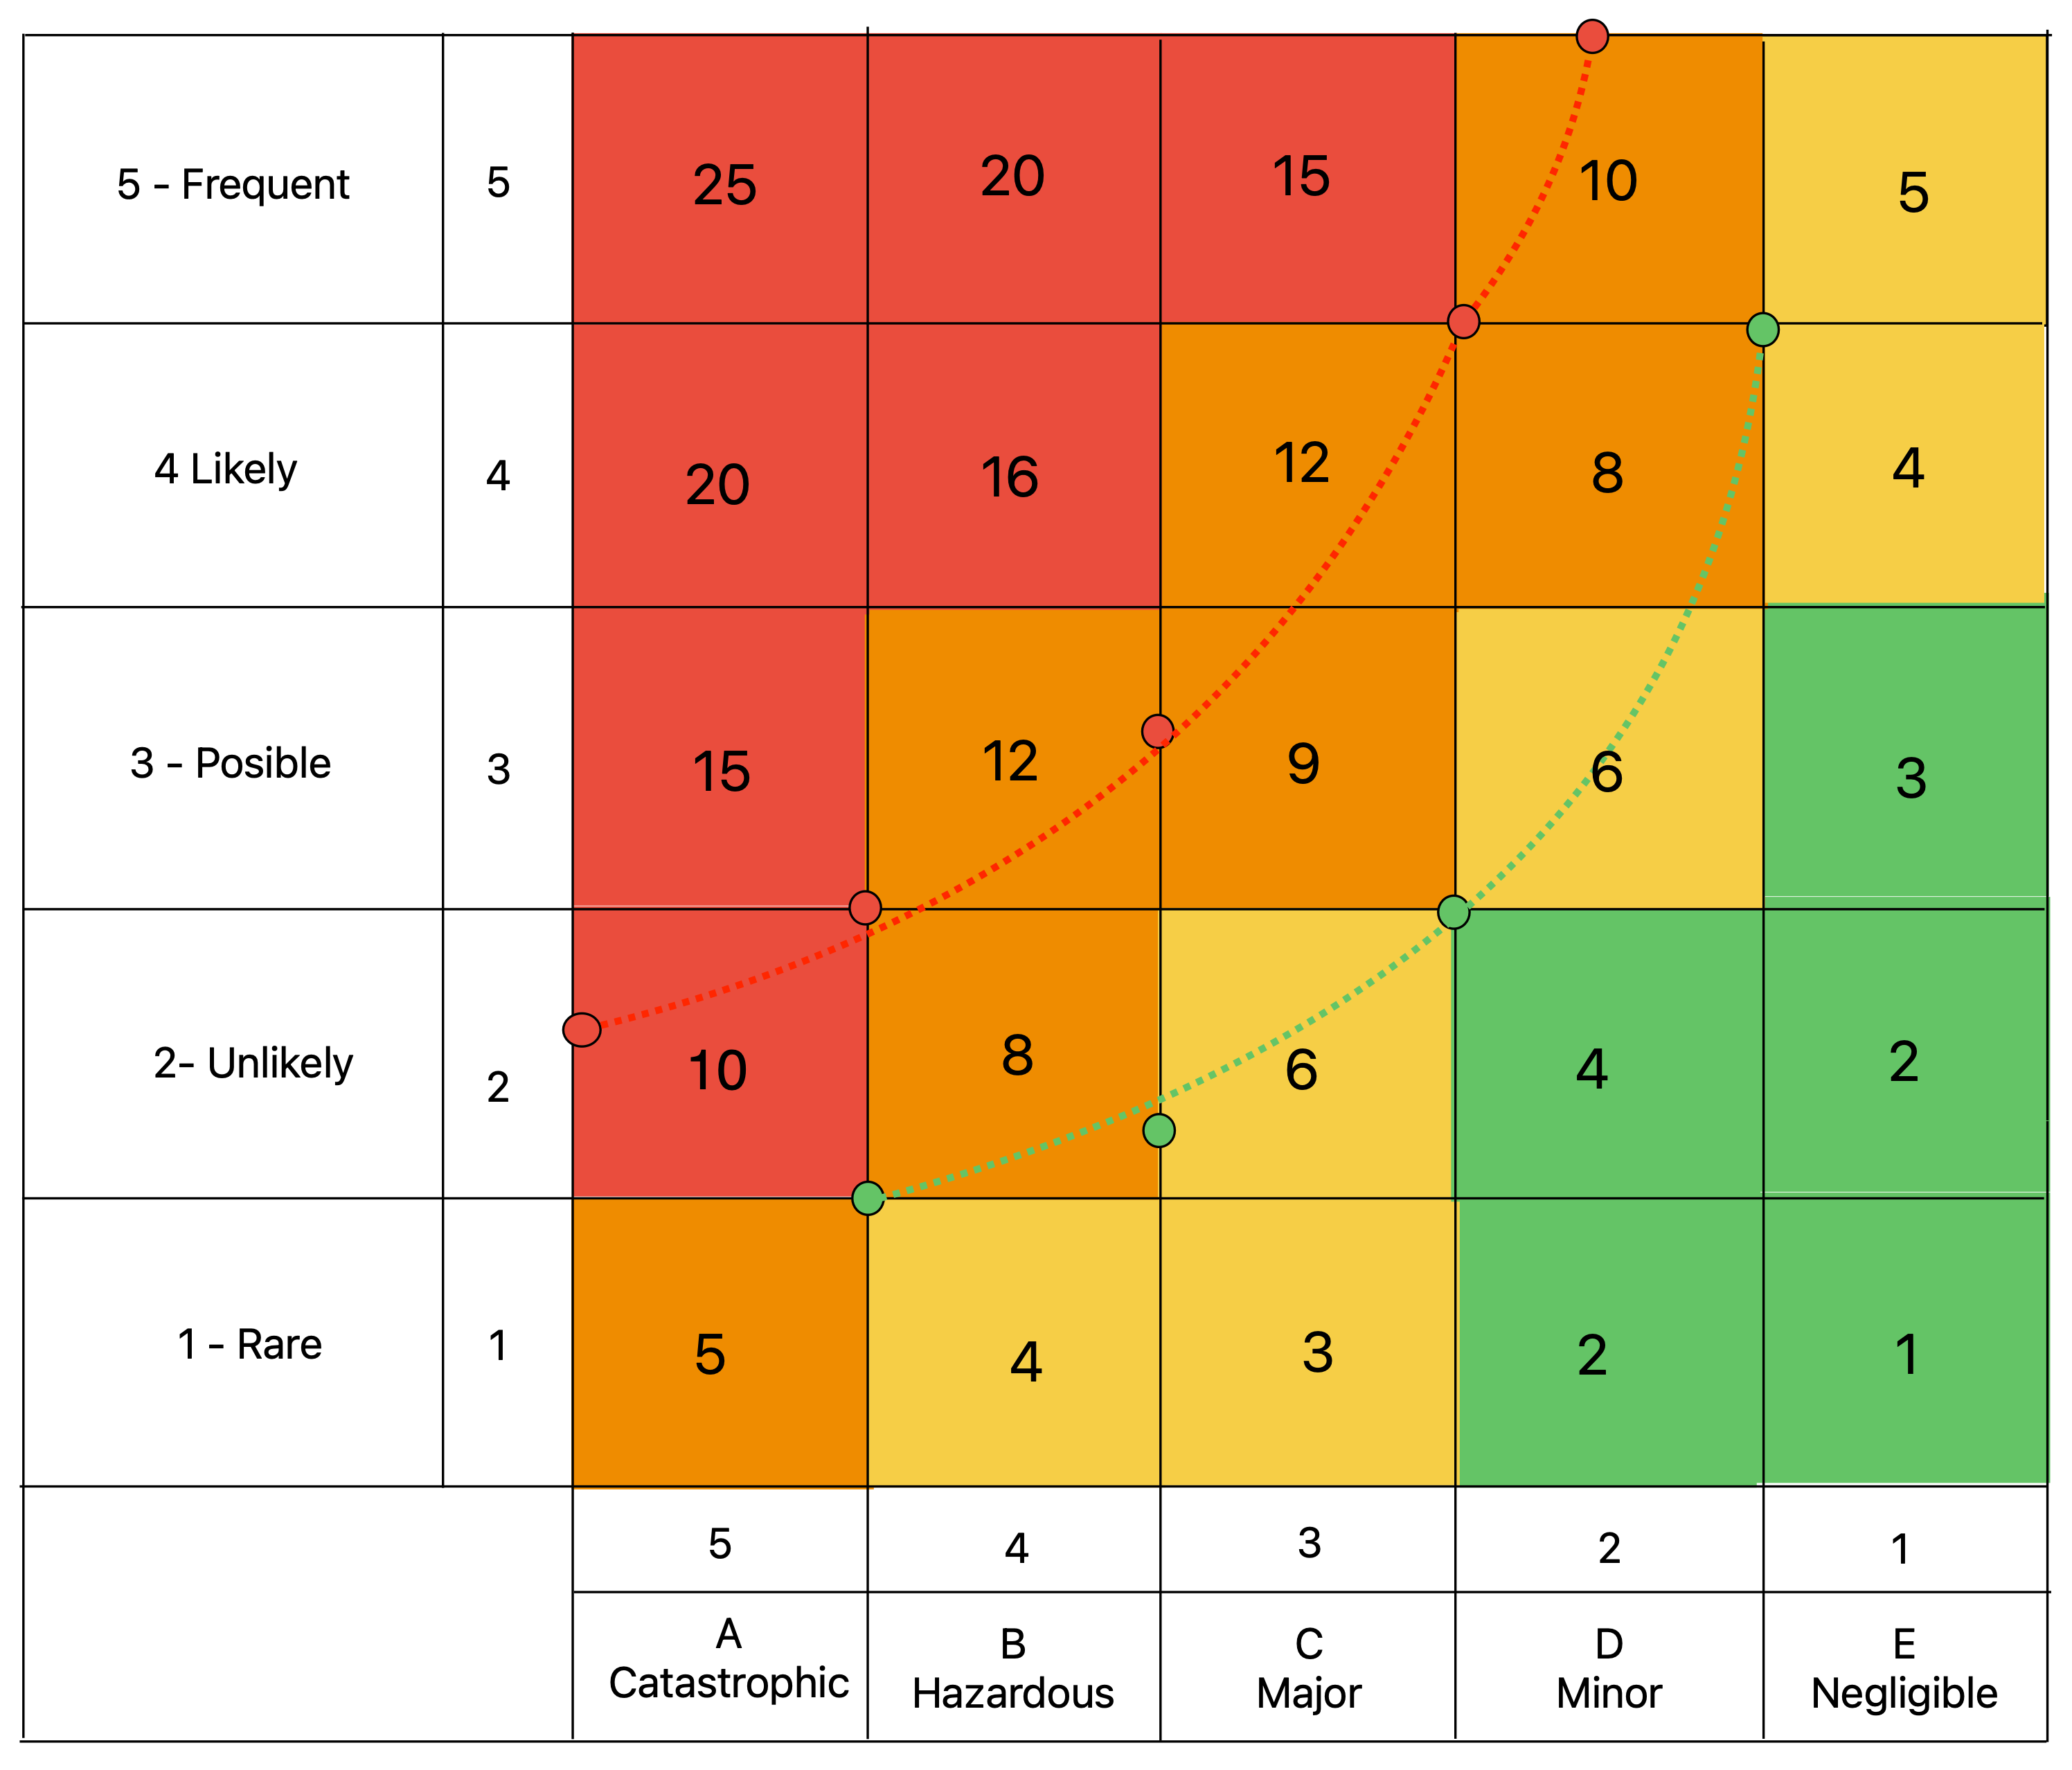
Fig.3 - 5x5 risk matrix with four risk levels and iso contours for red and green risk
How to limit the limitation and make the risk matrix still effective
Despite all limitations, risk matrices used wisely are still one of the best practical risk assessment tools for aviation service providers. Talbot [2] recognizes its practical advantages and defines the two most critical items required to make a risk matrix effective in supporting quality decision-making.
a) Well-defined risk statement
Talbot [2] recommends CASE as the best tool to articulate risk, where four risk properties are needed to be defined:
1. Consequence - what is the impact of the risk on your objectives?
2. Asset - what asset(s) are at risk?
3. Source - what are the hazards or threat actors behind the risk?
4. Event - what particular type of incident is being considered?
Personally, I prefer the Bow-Tie tool to communicate and visualize the risk, because it is focused on safety controls (the most effective tools we have to reduce the risk) and because it follows Prof. James Reason's ”Swiss cheese” model of accident causation.
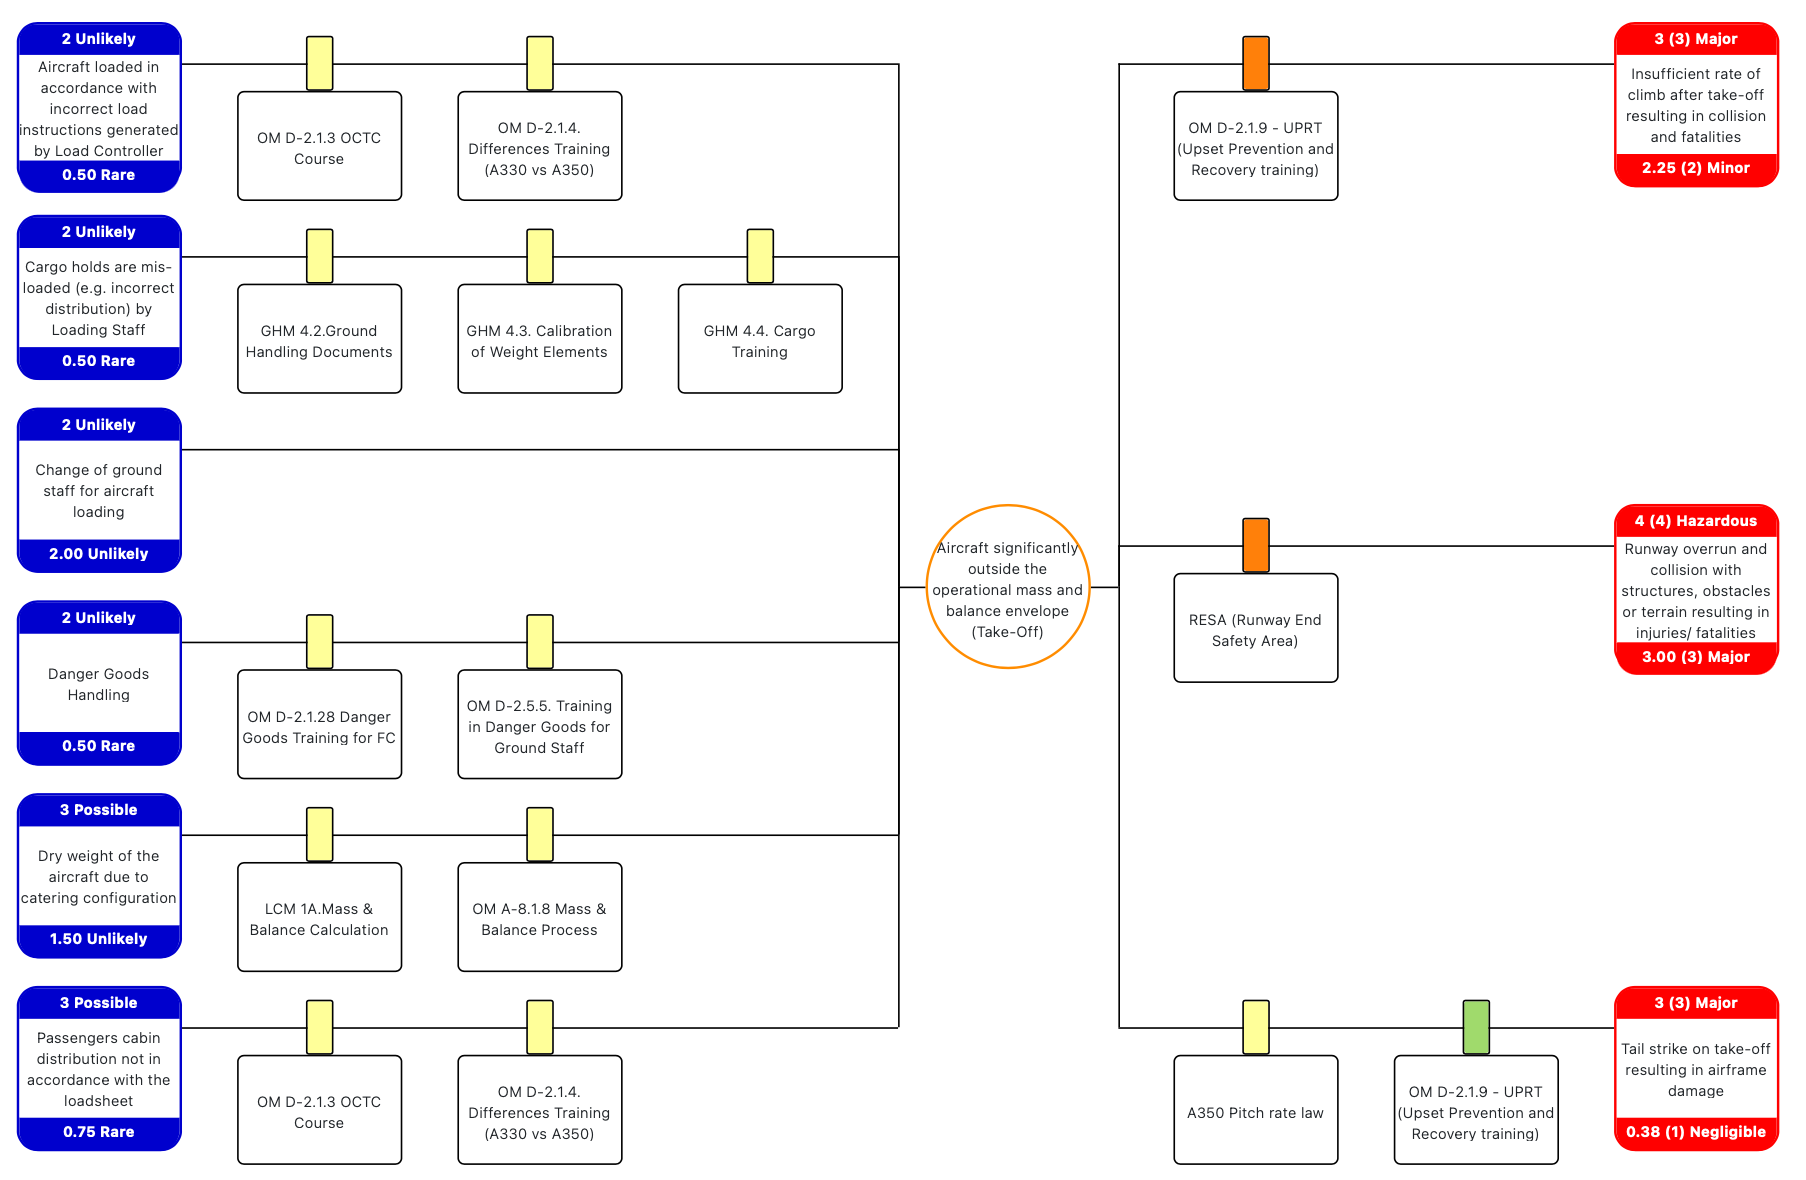
Fig.4 - GALIOT Bow-Tie example (simplified) for mass & balance take off risk.
b) Robust and unambiguity likelihood and consequence categories definitions
To eliminate human cognitive bias while selecting risk matrix inputs, the likelihood and consequence categories need to be robust and unambiguity defined. Although the severity and likelihood categories given as an example in ICAO Doc 9859 are neither robust nor unambiguity defined, many aviation service providers are using it in production without any changes and additional clarifications.
Instead of ICAO definition, safety practitioners should consider using severity categories proposed by Talbot [2] or FAA [5]. Talbot [2] defined more accuracy severity levels by adding separate consequence descriptors for the People, Information, Property, Economics, Reputation, and Capability domains.
FAA [5] approach is even better applicable for aviation because it uses different severity descriptors for Airports, ATC Services, Flying Public, Flight Crew, and Unmanned Aircraft Systems
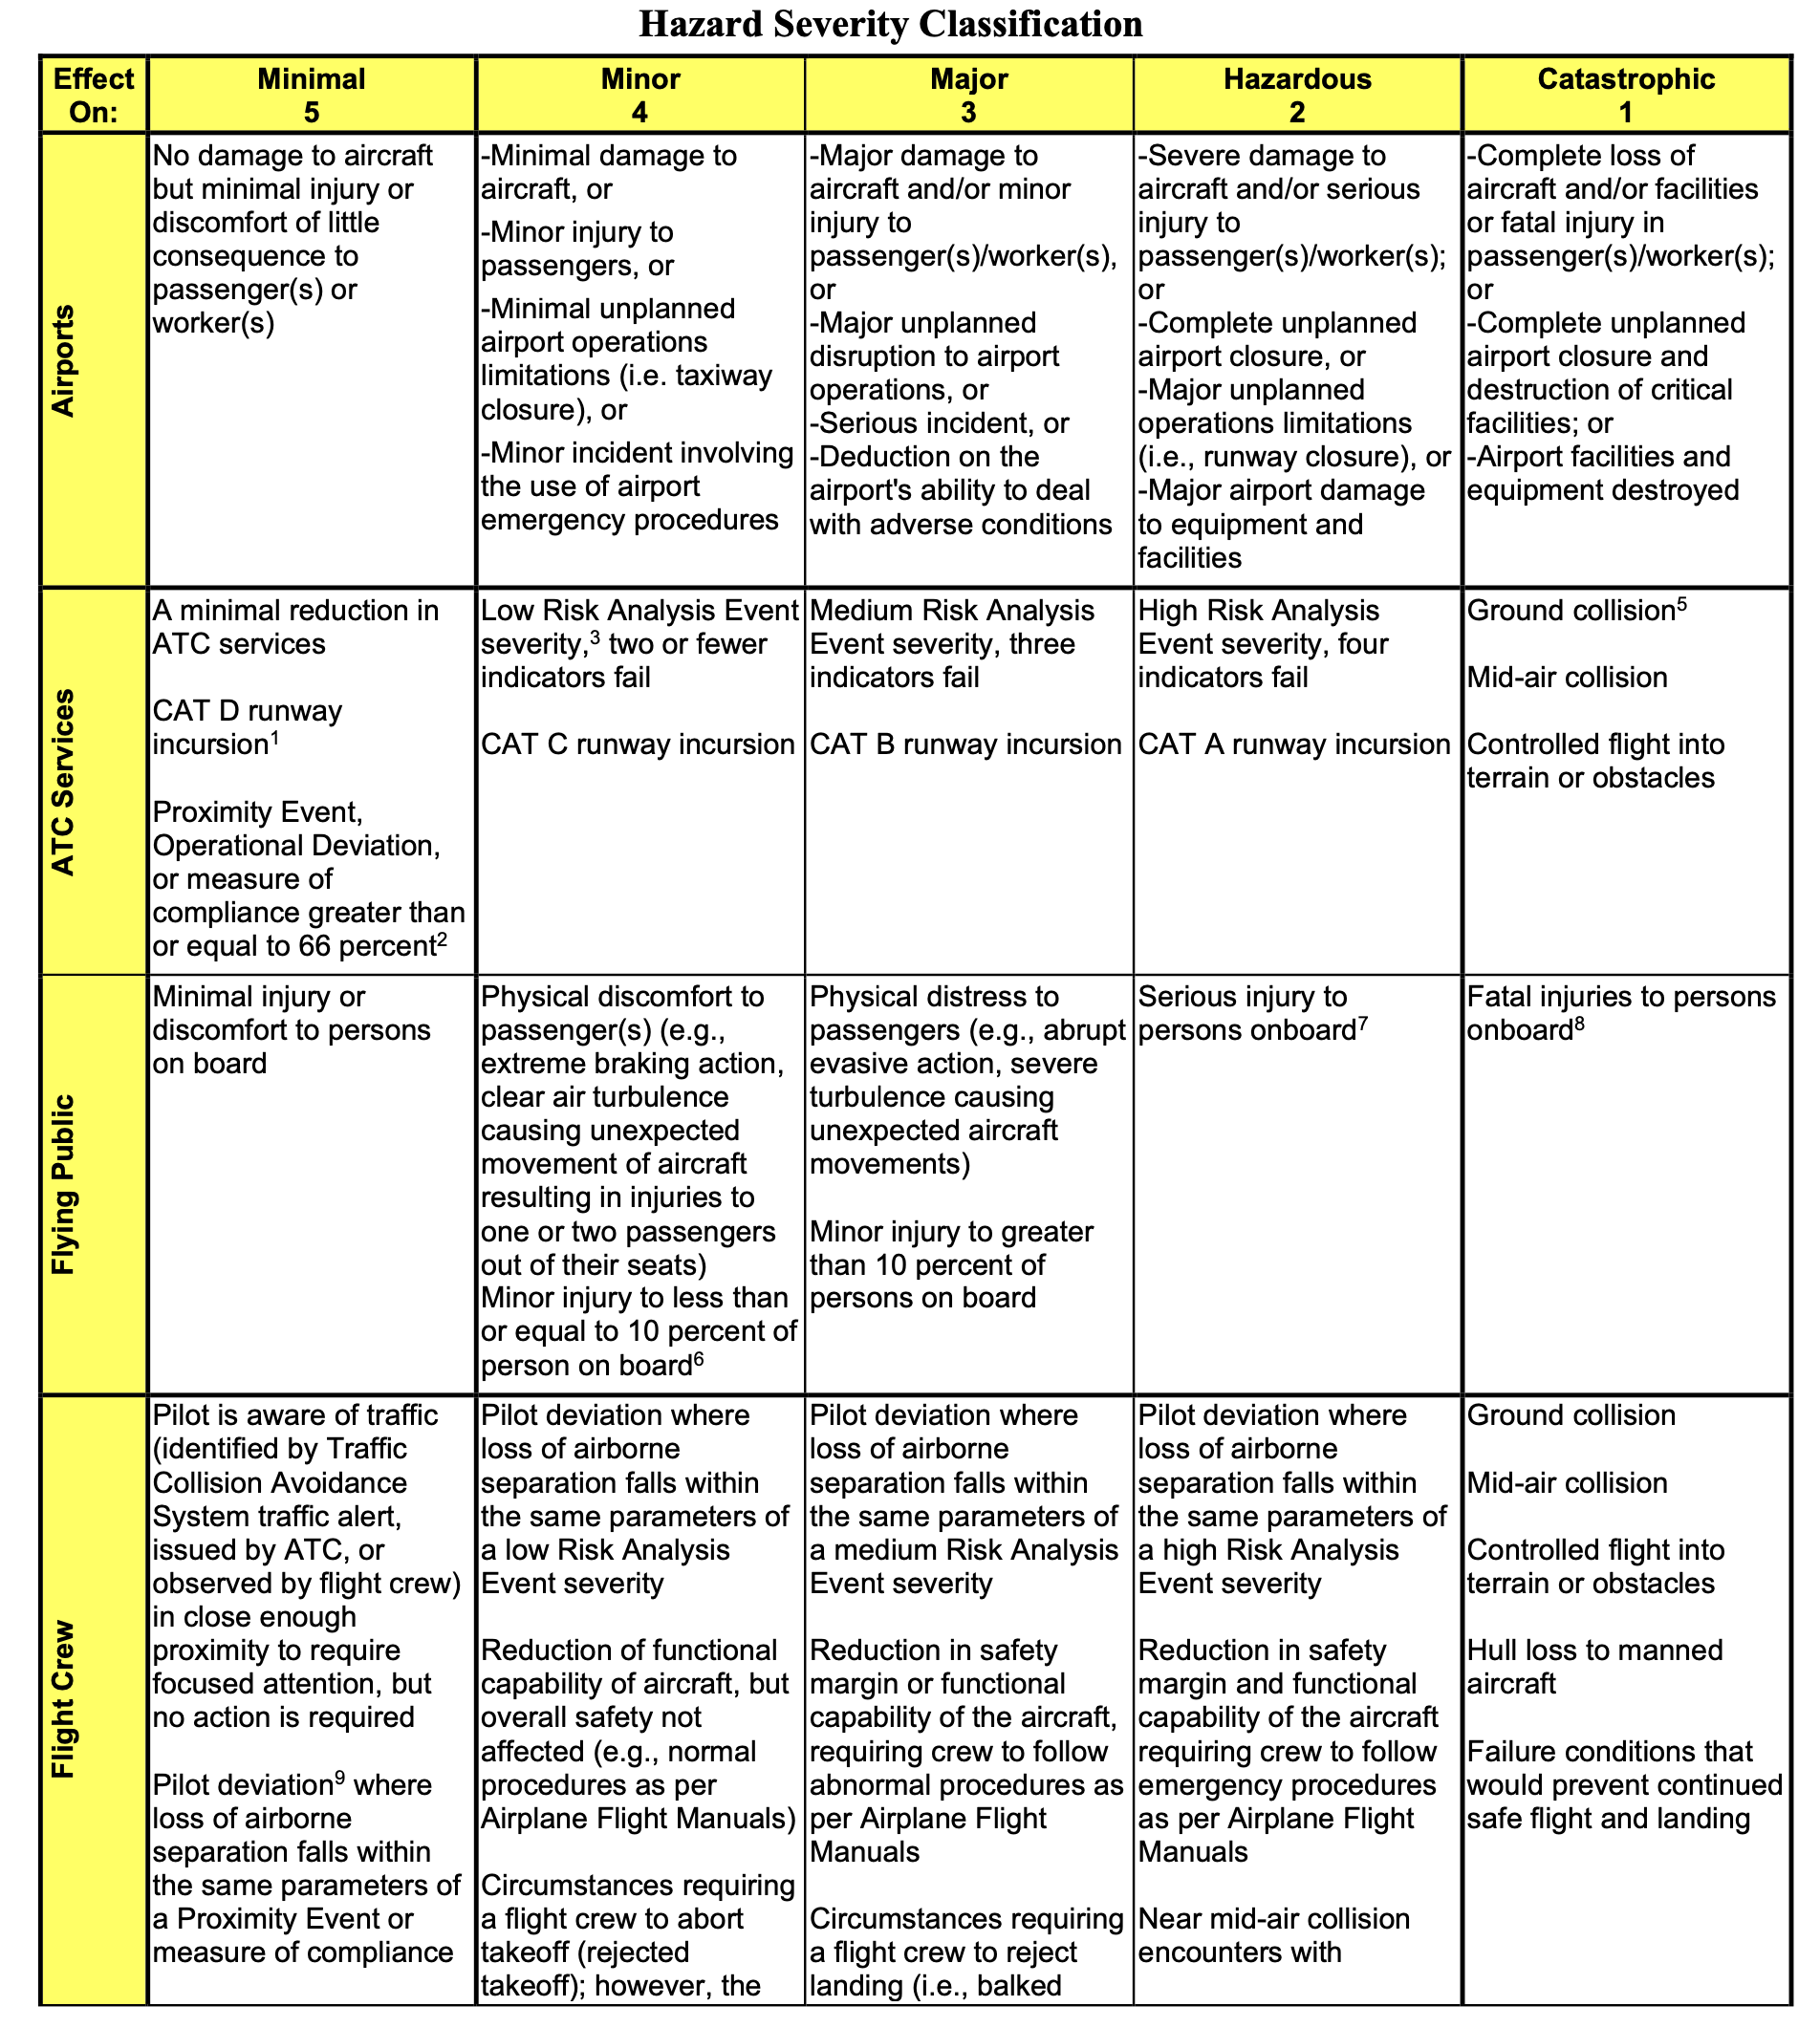
Fig.5 - FAA [5] - Segment of Hazard Severity Classification.
The same applies to ICAO likelihood category descriptors as well. These categories are doubtfully defined and additional quantitative information is needed (probability range or occurrence frequency per number of operations) to eliminate human cognitive bias.
Again, FAA [5] provides a more practical approach by adding different likelihood definitions for Airport Specific, Quantitative (AT/Flight Procedures/Systems Engineering), and Domain-wide: NAS-wide, Terminal, or En route occurrences.
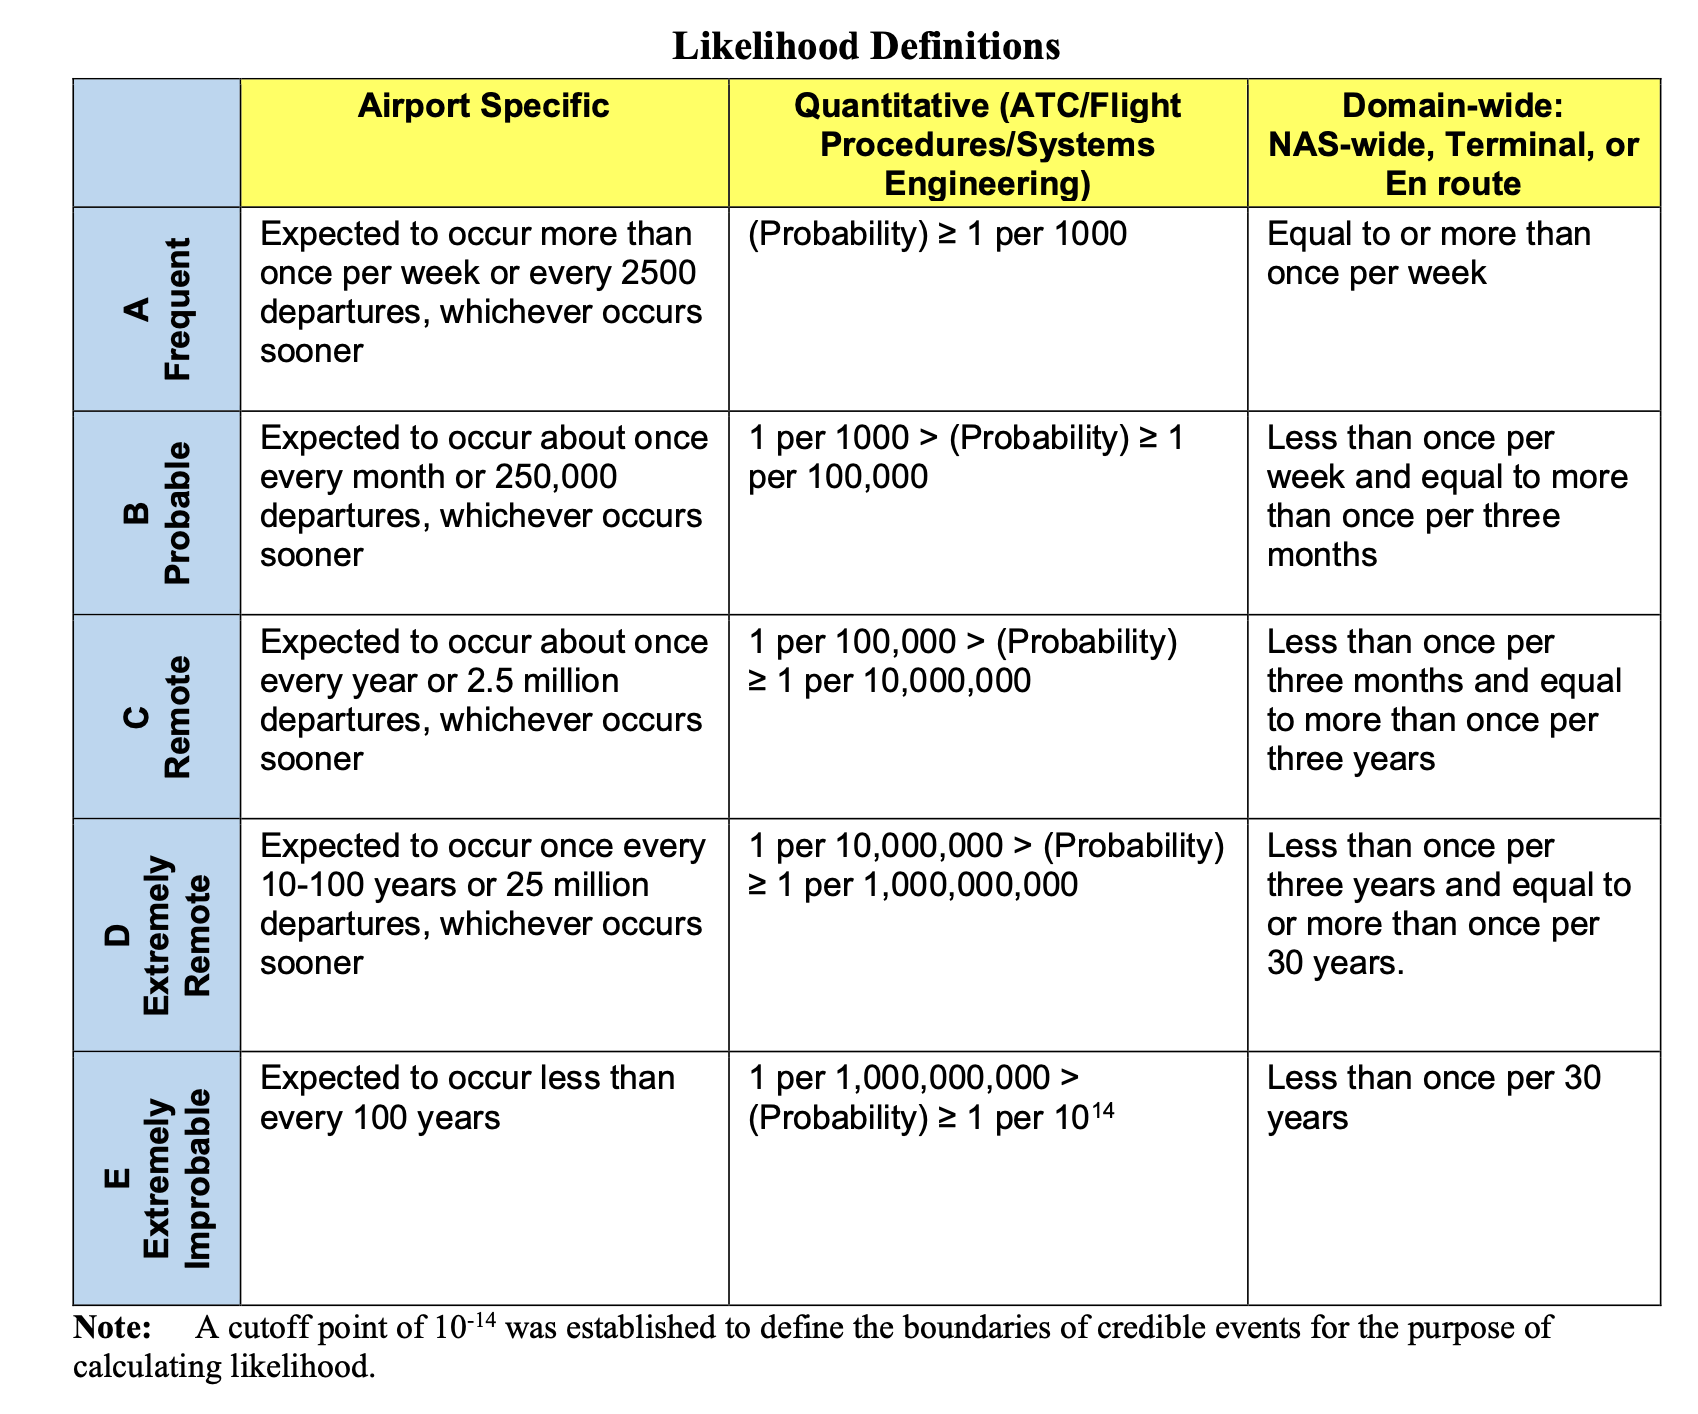
Fig.6 - FAA [5] - Likelihood Definitions
While selecting the appropriate severity level could be accomplished by implementing additional category descriptors, the problem of pressing real probability values into the likelihood ordinal scale remains, even when likelihood categories are detailed and undoubtedly described.
The real problem here is not descriptors themselves, but the deficiency of the representative historical data, i.e. data collected for a specific (or similar) service provider under the same predisposing condition (procedures used, implemented safety controls, safety culture, ….).
For most events, and especially for the most critical ones (low-frequency/high consequence occurrences), there are no representative data, either because these events are so rare or because of the different predisposing conditions (procedure changes, additional safety controls, different safety culture, weather, traffic conditions …).
Discussion about how to overcome the lack of historical data and whether the effectiveness of implemented safety controls could be used for likelihood scale selection is out of this blog's scope and will be covered in the following articles.
References
[1] Cox Jr., L.A., What's Wrong with Risk Matrices? Risk analysis, 2008.[2] Julian Talbot, What’s right with risk matrices? | Julian Talbot on Risk, Success and Leadership, 2018.
[Online]. Available: https://www.juliantalbot.com/post/2018/07/31/whats-right-with-risk-matrices
[3] ICAO Doc. 9859 Safety Management Manual (2018) Fourth Edition
[4] NIST Guide for Conducting Risk Assessment 800-30 rev.1 2012
[5] FAA Airports (ARP) Safety Management System, Order 5200.11A, Effective date 20th July 2021
Marino Tudor
Founder & CEOGaliot Aero Ltd
June, 2023